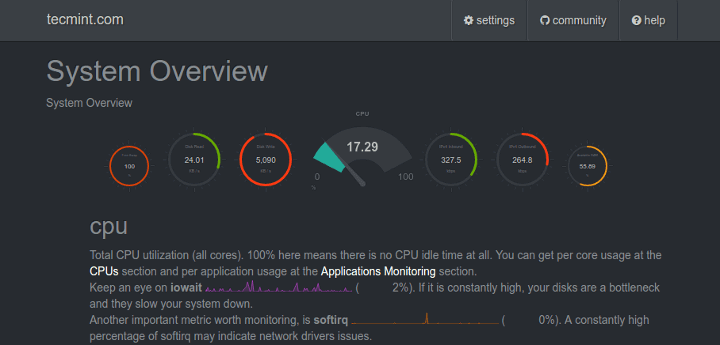
Netdata Custom Dashboard
Just posting this will come back to edit
Netdata custom dashboards
Posted on October 16, 2019 by Spencer LeB
Link to Existing dataNetdata Custom Dashboards
You can:
- create your own dashboards using simple HTML (no javascript is required for basic dashboards)
- utilizing any or all of the available chart libraries, on the same dashboard
- using data from one or more netdata servers, on the same dashboard
- host your dashboard HTML page on any web server, anywhere
netdata charts can also be added to existing web pages.
Check this very simple working example of a custom dashboard, and its html source.
If you plan to put it on TV, check tv.html. This is a screenshot of it, monitoring 2 servers on the same page:
Web directory
The default web root directory is /usr/share/netdata/web where you will find examples such as tv.html, and demo.html as well as the main dashboard contained in index.html.
Note: index.html have a different syntax. Don’t use it as a template for simple custom dashboards.
Example empty dashboard
If you need to create a new dashboard on an empty page, we suggest the following header:
<!DOCTYPE html>
<html lang="en">
<head>
	<title>Your dashboard</title>

	<meta http-equiv="Content-Type" content="text/html; charset=utf-8" />
	<meta charset="utf-8">
	<meta http-equiv="X-UA-Compatible" content="IE=edge,chrome=1">
	<meta name="viewport" content="width=device-width, initial-scale=1">
	<meta name="apple-mobile-web-app-capable" content="yes">
	<meta name="apple-mobile-web-app-status-bar-style" content="black-translucent">

	<!-- here we will add dashboard.js -->

</head>
<body>

<!-- here we will add charts -->

</body>
</html>
dashboard.js
To add netdata charts to any web page (dedicated to netdata or not), you need to include the /dashboard.js file of a netdata server.
For example, if your netdata server listens at http://box:19999/, you will need to add the following to the head section of your web page:
<script type="text/javascript" src="http://box:19999/dashboard.js"></script>
what dashboard.js does?
dashboard.js will automatically load the following:
dashboard.css, required for the netdata chartsjquery.min.js, (only if jquery is not already loaded for this web page)bootstrap.min.js(only if bootstrap is not already loaded) andbootstrap.min.css.You can disable this by adding the following before loadingdashboard.js:
<script>var netdataNoBootstrap = true;</script>
jquery.nanoscroller.min.js, required for the scrollbar of the chart legends.bootstrap-toggle.min.jsandbootstrap-toggle.min.css, required for the settings toggle buttons.font-awesome.min.css, for icons.
When dashboard.js loads will scan the page for elements that define charts (see below) and immediately start refreshing them. Keep in mind more javascript modules may be loaded (every chart library is a different javascript file, that is loaded on first use).
Prevent dashboard.js from starting chart refreshes
If your web page is not static and you plan to add charts using javascript, you can tell dashboard.js not to start processing charts immediately after loaded, by adding this fragment before loading it:
<script>var netdataDontStart = true;</script>
The above, will inform the dashboard.js to load everything, but not process the web page until you tell it to. You can tell it to start processing the page, by running this javascript code:
NETDATA.start();
Be careful not to call the NETDATA.start() multiple times. Each call to this function will spawn a new thread that will start refreshing the charts.
If, after calling NETDATA.start() you need to update the page (or even get your javascript code synchronized with dashboard.js), you can call (after you loaded dashboard.js):
NETDATA.pause(function() {
  // ok, it is paused

  // update the DOM as you wish

  // and then call this to let the charts refresh:
  NETDATA.unpause();
});
The default netdata server
dashboard.js will attempt to auto-detect the URL of the netdata server it is loaded from, and set this server as the default netdata server for all charts.
If you need to set any other URL as the default netdata server for all charts that do not specify a netdata server, add this before loading dashboard.js:
<script type="text/javascript">var netdataServer = "http://your.netdata.server:19999";</script>
Adding charts
To add charts, you need to add a div for each of them. Each of these div elements accept a few data- attributes:
The chart unique ID
The unique ID of a chart is shown at the title of the chart of the default netdata dashboard. You can also find all the charts available at your netdata server with this URL: http://your.netdata.server:19999/api/v1/charts (example).
To specify the unique id, use this:
<div data-netdata="unique.id"></div>
The above is enough for adding a chart. It most probably have the wrong visual settings though. Keep reading…
The duration of the chart
You can specify the duration of the chart (how much time of data it will show) using:
<div data-netdata="unique.id"
     data-after="AFTER_SECONDS"
     data-before="BEFORE_SECONDS"
     ></div>
AFTER_SECONDS and BEFORE_SECONDS are numbers representing a time-frame in seconds.
The can be either:
- absolute unix timestamps (in javascript terms, they are
new Date().getTime() / 1000. Using absolute timestamps you can have a chart showing always the same time-frame. - relative number of seconds to now. To show the last 10 minutes of data,
AFTER_SECONDSmust be-600(relative to now) andBEFORE_SECONDSmust be0(meaning: now). If you want the chart to auto-refresh the current values, you need to specify relative values.
Chart dimensions
You can set the dimensions of the chart using this:
<div data-netdata="unique.id"
     data-width="WIDTH"
     data-height="HEIGHT"
     ></div>
WIDTH and HEIGHT can be anything CSS accepts for width and height (e.g. percentages, pixels, etc). Keep in mind that for certain chart libraries, dashboard.js may apply an aspect ratio to these.
If you want dashboard.js to remember permanently (browser local storage) the dimensions of the chart (the user may resize it), you can add: data-id="SETTINGS_ID", where SETTINGS_ID is anything that will be common for this chart across user sessions.
Netdata server
Each chart can get data from a different netdata server. You can give per chart the netdata server using:
<div data-netdata="unique.id"
     data-host="http://another.netdata.server:19999/"
     ></div>
Chart library
The default chart library is dygraph. You set a different chart library per chart using this:
<div data-netdata="unique.id"
     data-chart-library="gauge"
     ></div>
Each chart library may support more chart-library specific settings. Please refer to the documentation of the chart library you are interested, in this wiki.
Data points
For the time-frame requested, dashboard.js will use the chart dimensions and the settings of the chart library to find out how many data points it can show.
For example, most line chart libraries are using 3 pixels per data point. If the chart shows 10 minutes of data (600 seconds), its update frequency is 1 second, and the chart width is 1800 pixels, then dashboard.js will request from the netdata server: 10 minutes of data, represented in 600 points, and the chart will be refreshed per second. If the user resizes the window so that the chart becomes 600 pixels wide, then dashboard.js will request the same 10 minutes of data, represented in 200 points and the chart will be refreshed once every 3 seconds.
If you need to have a fixed number of points in the data source retrieved from the netdata server, you can set:
<div data-netdata="unique.id"
     data-points="DATA_POINTS"
     ></div>
Where DATA_POINTS is the number of points you need.
You can also overwrite the pixels-per-point per chart using this:
<div data-netdata="unique.id"
     data-pixels-per-point="PIXELS_PER_POINT"
     ></div>
Where PIXELS_PER_POINT is the number of pixels each data point should occupy.
Data grouping method
Netdata supports average (the default) or max grouping methods. The grouping method is used when the netdata server is requested to return fewer points for a time-frame, compared to the number of points available.
You can give it per chart, using:
<div data-netdata="unique.id"
     data-method="max"
     ></div>
Selecting dimensions
By default, dashboard.js will show all the dimensions of the chart. You can select specific dimensions using this:
<div data-netdata="unique.id"
     data-dimensions="dimension1,dimension2,dimension3,..."
     ></div>
Chart title
You can overwrite the title of the chart using this:
<div data-netdata="unique.id"
     data-title="my super chart"
     ></div>
Chart units
You can overwrite the units of measurement of the dimensions of the chart, using this:
<div data-netdata="unique.id"
     data-units="words/second"
     ></div>
Chart colors
dashboard.js has an internal palette of colors for the dimensions of the charts. You can prepend colors to it (so that your will be used first) using this:
<div data-netdata="unique.id"
     data-colors="#AABBCC #DDEEFF ..."
     ></div>
Extracting dimension values
dashboard.js can update the selected values of the chart at elements you specify. For example, let’s assume we have a chart that measures the bandwidth of eth0, with 2 dimensions in and out. You can use this:
<div data-netdata="net.eth0"
     data-show-value-of-in-at="eth0_in_value"
     data-show-value-of-out-at="eth0_out_value"
     ></div>

My eth0 interface, is receiving <span id="eth0_in_value"></span>
and transmitting <span id="eth0_out_value"></span>.
Hiding the legend of a chart
On charts that by default have a legend managed by dashboard.js you can remove it, using this:
<div data-netdata="unique.id"
     data-legend="no"
     ></div>
API options
You can append netdata REST API v1 data options, using this:
<div data-netdata="unique.id"
     data-append-options="absolute,percentage"
     ></div>
Chart library performance
dashboard.js measures the performance of the chart library when it renders the charts. You can specify an element ID you want this information to be visualized, using this:
<div data-netdata="unique.id"
     data-dt-element-name="measurement1"
     ></div>

refreshed in <span id="measurement1"></span> milliseconds!
So running Netdata on PFsense and Docker host (Linux)
Was able to scrape the data, and build 3 webpages served by Docker HTTP web server..
Page 2 and 3 redirect back to each other so its a loop!
It was a little slow and tedious but i got what i needed..
Plan to put this on a display just looping endlessly, will add more host pages to it later.
I initially tried Prometheus+Netdata+Grafana, but it was even more tedious …